Attitudes | 2023
Web app for Attitudes
Web app for Attitudes
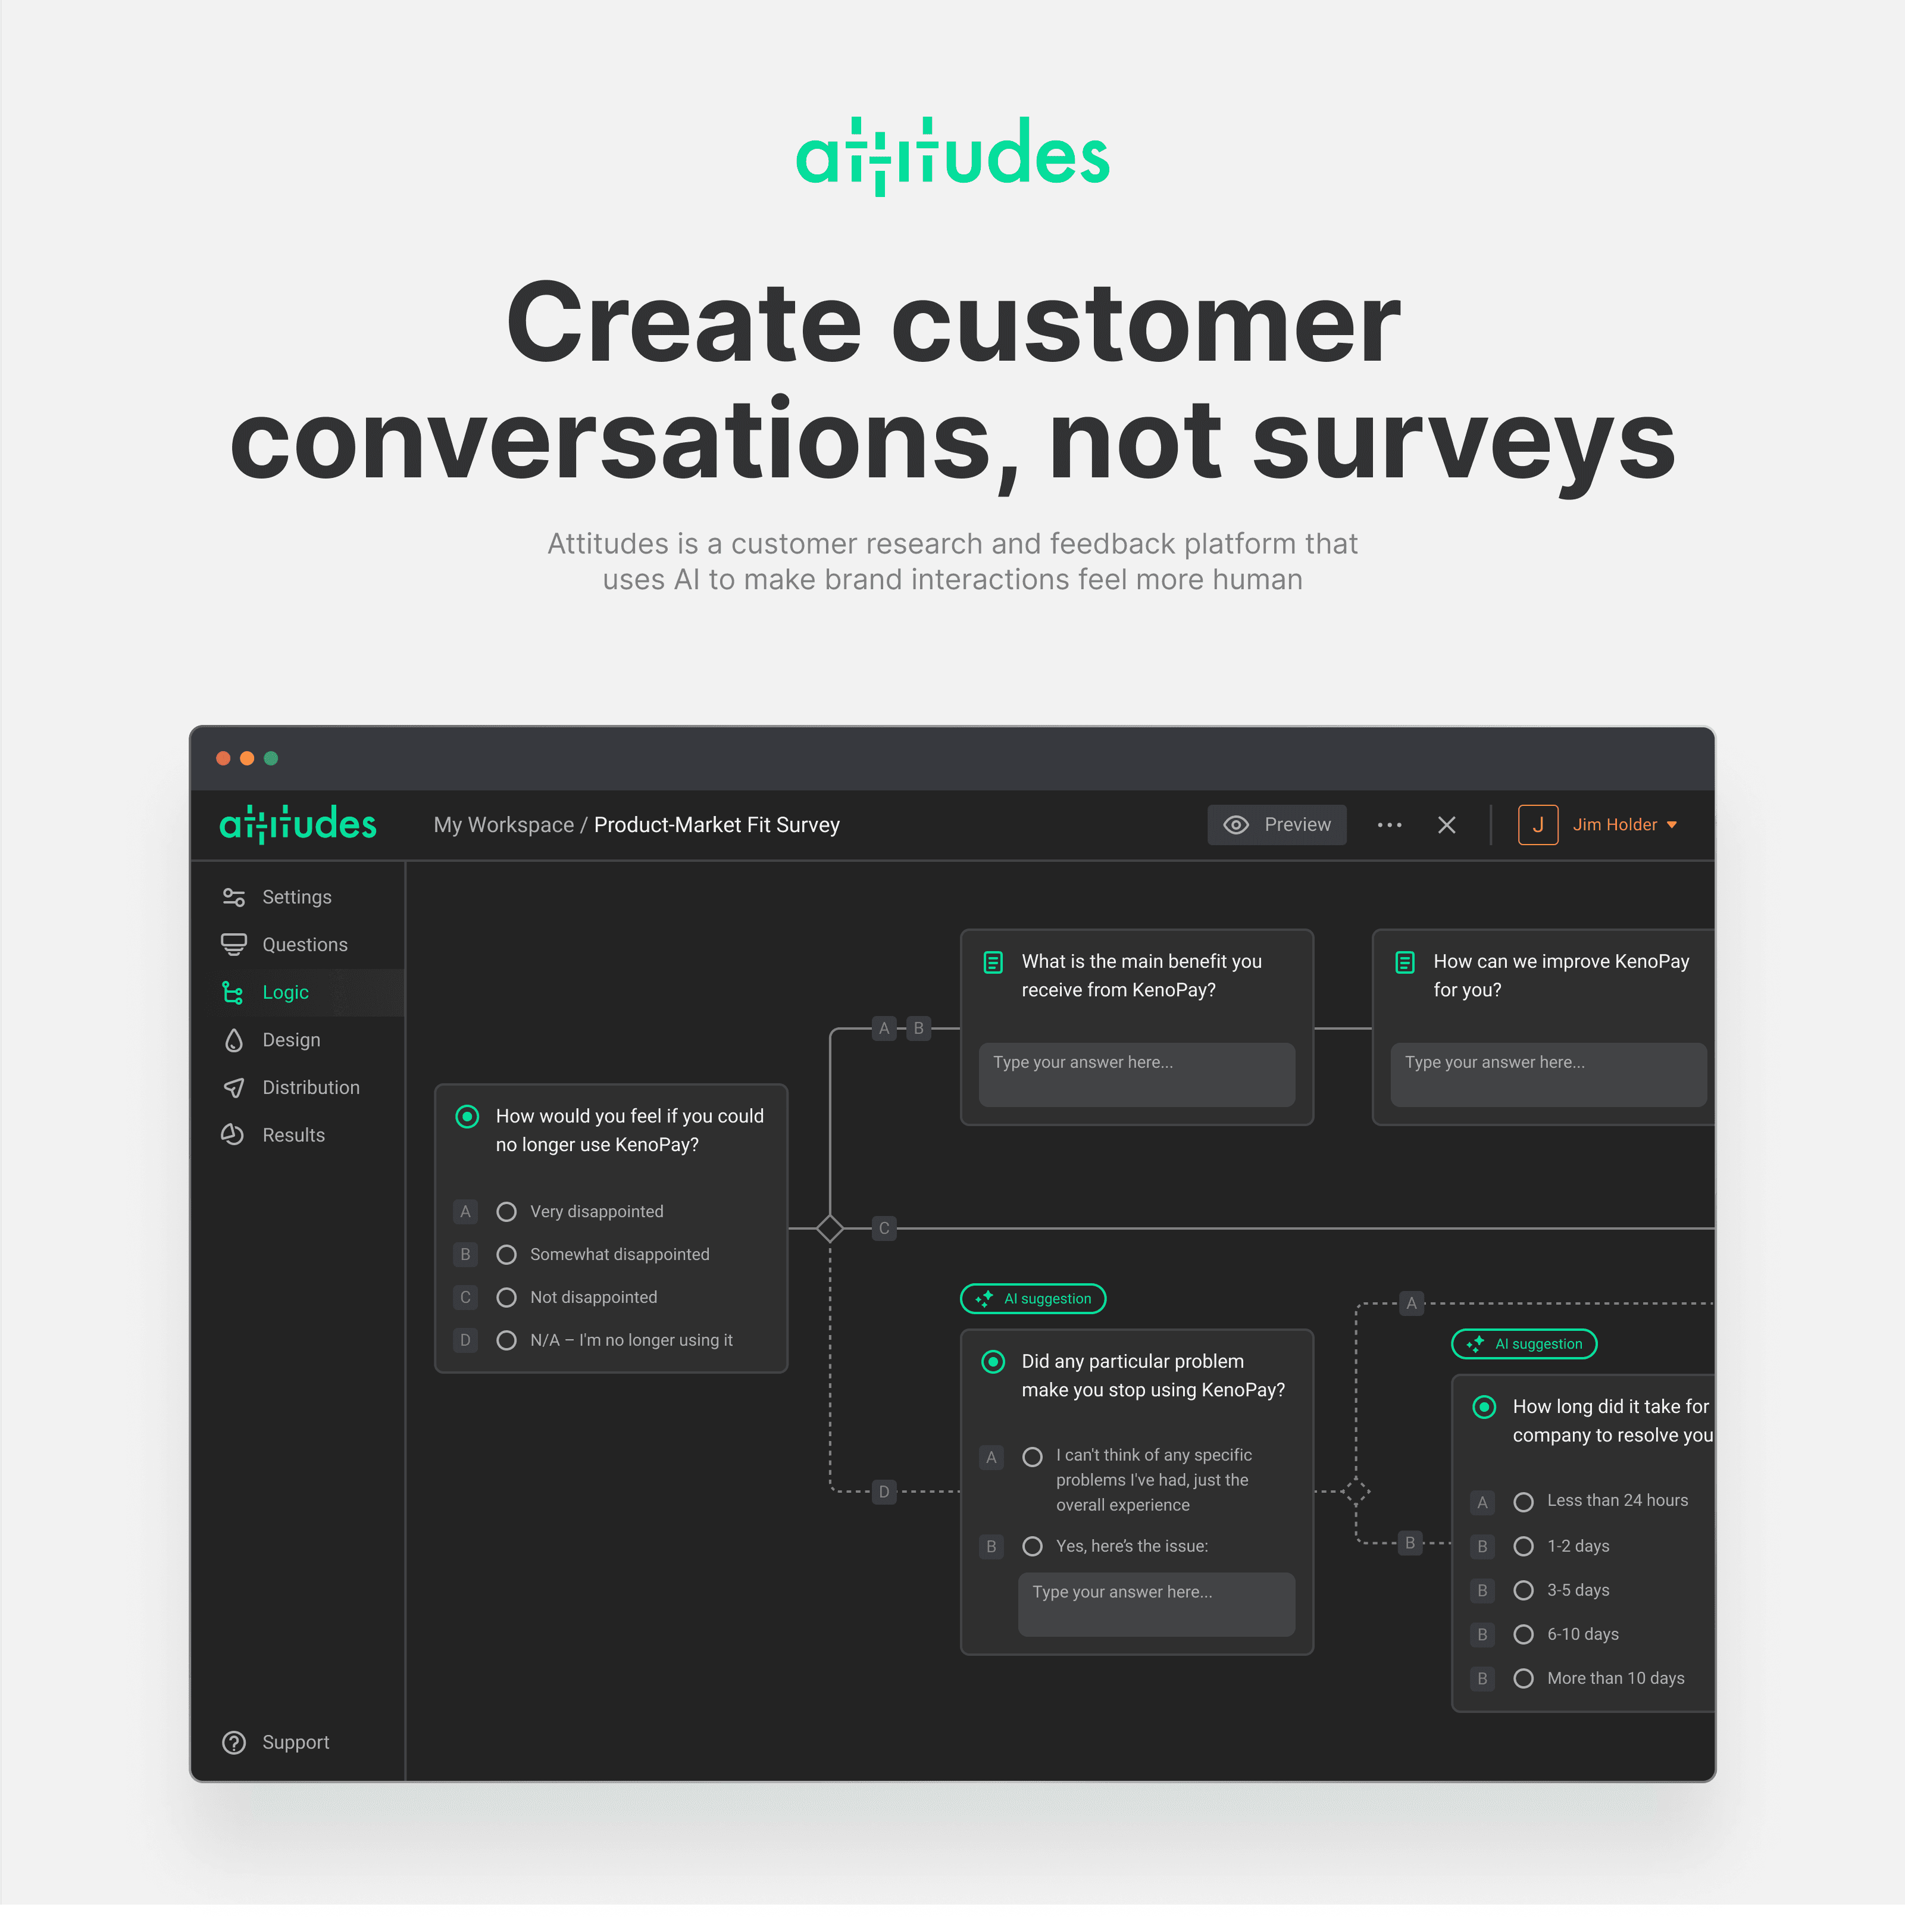
Attitudes is an AI-powered platform for user research and feedback surveys. It's built-in AI mimics human communication by creating branching paths in surveys, skipping irrelevant questions, acknowledging previous responses, and adjusting tone of voice to truly capture the full scope of customer's thoughts and feedback.
As I was exploring the startup idea in this space, I conducted a market study, conducted thorough customer research, created a detailed platform concept, developed initial prototypes, and designed user interfaces.
My role:
UX Research
UX Strategy
UI Design
UX Writing
The challenge
The online survey software market is projected to grow at a CAGR of 16.04%, hitting a value of $13.8B by 2026. However, the average survey response rate is typically low, falling between 20% and 30%. Let's face it: most people hate surveys, but they are an essential part of any business.
$13.8B
Expected size of an online survey software market by 2026
20-30%
Average survey response rate
Source: Knowledge Sourcing Intelligence, Qualtrics
Survey response rate refers to the percentage of people who complete a survey out of the total number of people who were invited to participate in the survey. For example, if a survey was sent to 100 people, and 20 of them responded, the response rate would be 20%.
Survey response rate refers to the percentage of people who complete a survey out of the total number of people who were invited to participate in the survey. For example, if a survey was sent to 100 people, and 20 of them responded, the response rate would be 20%.
- Traditional market research methods tend to be clinical and overly formal, and are off-putting, particularly for Gen Zs and Millennials.
- In my experience, most online survey software available was either too cumbersome and complex or too simplistic to facilitate personalized and meaningful interactions with customers.
Standardized multiple-choice answers delivered only basic insights, but deeper insights required personal conversations, follow-up questions, or at least free-form answers. However, obtaining and analyzing these types of responses could be quite difficult, expensive and time-consuming.
Goal: to create an online survey tool that would deliver better survey experience both for creators and respondents
Goal: to create an online survey tool that would deliver better survey experience both for creators and respondents
Key learnings
In order to understand the perspectives of potential users of online survey software, I conducted several types of research:
Competitive analysis: I examined how leading tools in the market advertise and present themselves, their emphasized features, and promoted use cases.
User interviews: I conducted four interviews with marketing colleagues, startup founders, and customer success leaders.
Desk research: I reviewed online survey benchmarks and best practices for creating efficient surveys.
Problem: average survey response rate is typically low, falling between 20% and 30%. People are tired of formal, non-personalized and repetitive surveys.
Problem: average survey response rate is typically low, falling between 20% and 30%. People are tired of formal, non-personalized and repetitive surveys.
Here are some of the key insights from the interviews and research:
The survey response rate is a key metric. Survey software companies tend to focus on this figure when they analyse survey efficiency and prove value to their customers. Typically, the figures seem to fall between 20% and 30%. A low response rate is anything below 10%; a good response rate is above 50%. Second most important metric is the completion rate, i.e. the amount of people that complete the survey after starting it.
According to the data from BlockSurvey, skip logic surveys, when done right, can increase survey completion rates by as much as 375%. However, creating good branching logic is very time-consuming and increases survey complexity.
Survey fatigue is real. People hesitate to participate or complete the surveys if they receive too many requests or if the surveys are too long, non-personalized, or repetitive.
Bias in survey design: The way survey questions are phrased and structured can influence responses significantly and introduce bias.
Analyzing open-ended responses requires human input and can be time-consuming and costly. Additionally, there may be inconsistencies in how responses are categorized and analyzed, leading to potential errors in the data.
Incentives, such as rewards or compensation, can increase response rates but may also attract low-quality responses.
Gen Z is one of the toughest demographics to reach via email, which is the most popular tool for delivering online surveys. More than one-third of Gen Z and Millennials have over 1,000 unread emails in their inboxes.
375%
Skip logic surveys, when done right, can increase survey completion rates by as much as 375%
Source: BlockSurvey
Skip logic surveys use branching logic to skip certain questions depending on the user's responses. The purpose of skip logic is to make the survey more efficient and tailored to the user's specific needs or interests, as they only see questions that are relevant to them.
Survey completion rate is the percentage of people who finished the survey after they started it. It helps to figure out how easy the survey is to take, as well as whether there are any roadblocks or pain points with the survey experience.
The solution
I focused my solution on improving the survey experience itself, with the goal of increasing completion rates. I also focused on improving the way in which the results are analyzed and represented in order to retrieve as many insights from them as possible. With natural language processing models like ChatGPT or GPT-3, many time-consuming tasks related to survey design and analysis can be automated, increasing survey quality level and experience immensely.
Solution: use AI to make surveys more human
Solution: use AI to make surveys more human
After gathering all the insights, I've created a detailed platform concept, brainstormed potential key features, developed initial prototypes, and designed user interfaces. I've divided features by the stages in the survey creation process.
Create survey
Suggested questions and formats. AI-enabled suggestions based on most popular tasks, position of the person creating the survey, industry, survey type and topic. Ensuring questions are clear and unbiased. Suggestions of question type (multiple-choice, free-form, etc.) based on questions asked.
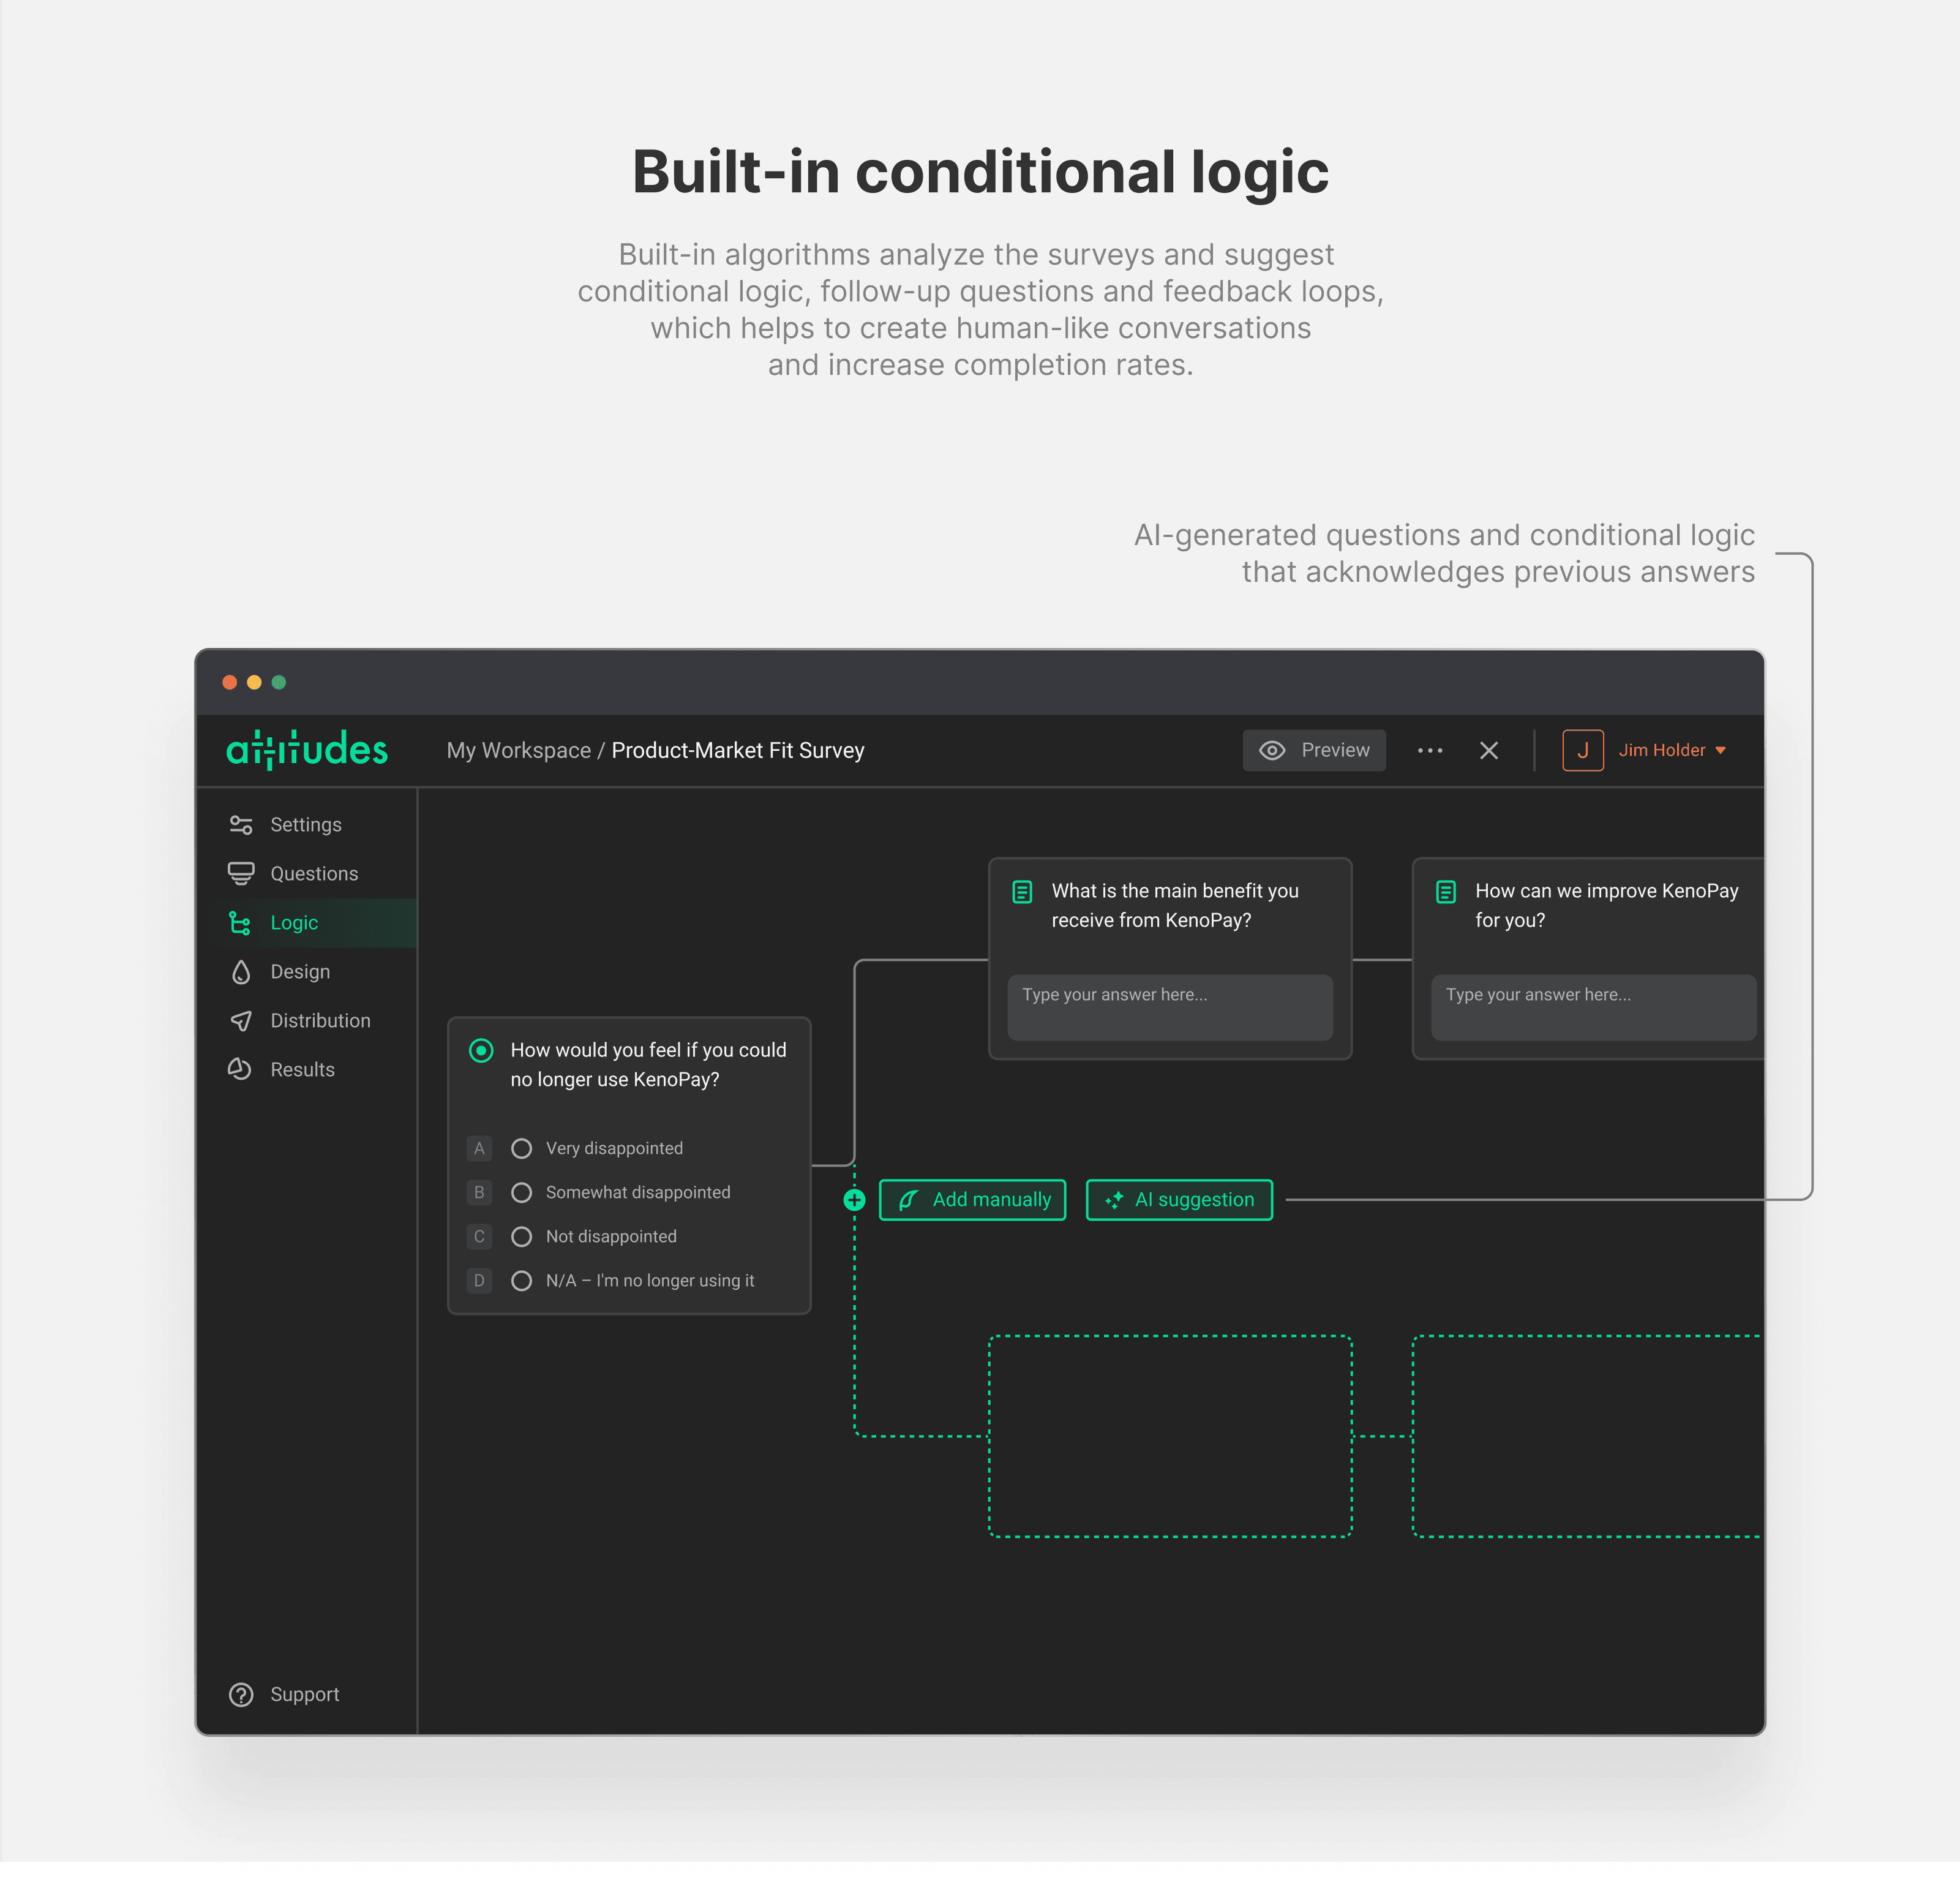
Automated survey logic. Using artificial intelligence to add branching logic for skipping questions, creation of follow-up questions, and "fillers"/"connectors" between questions to acknowledge previous answers of respondents.
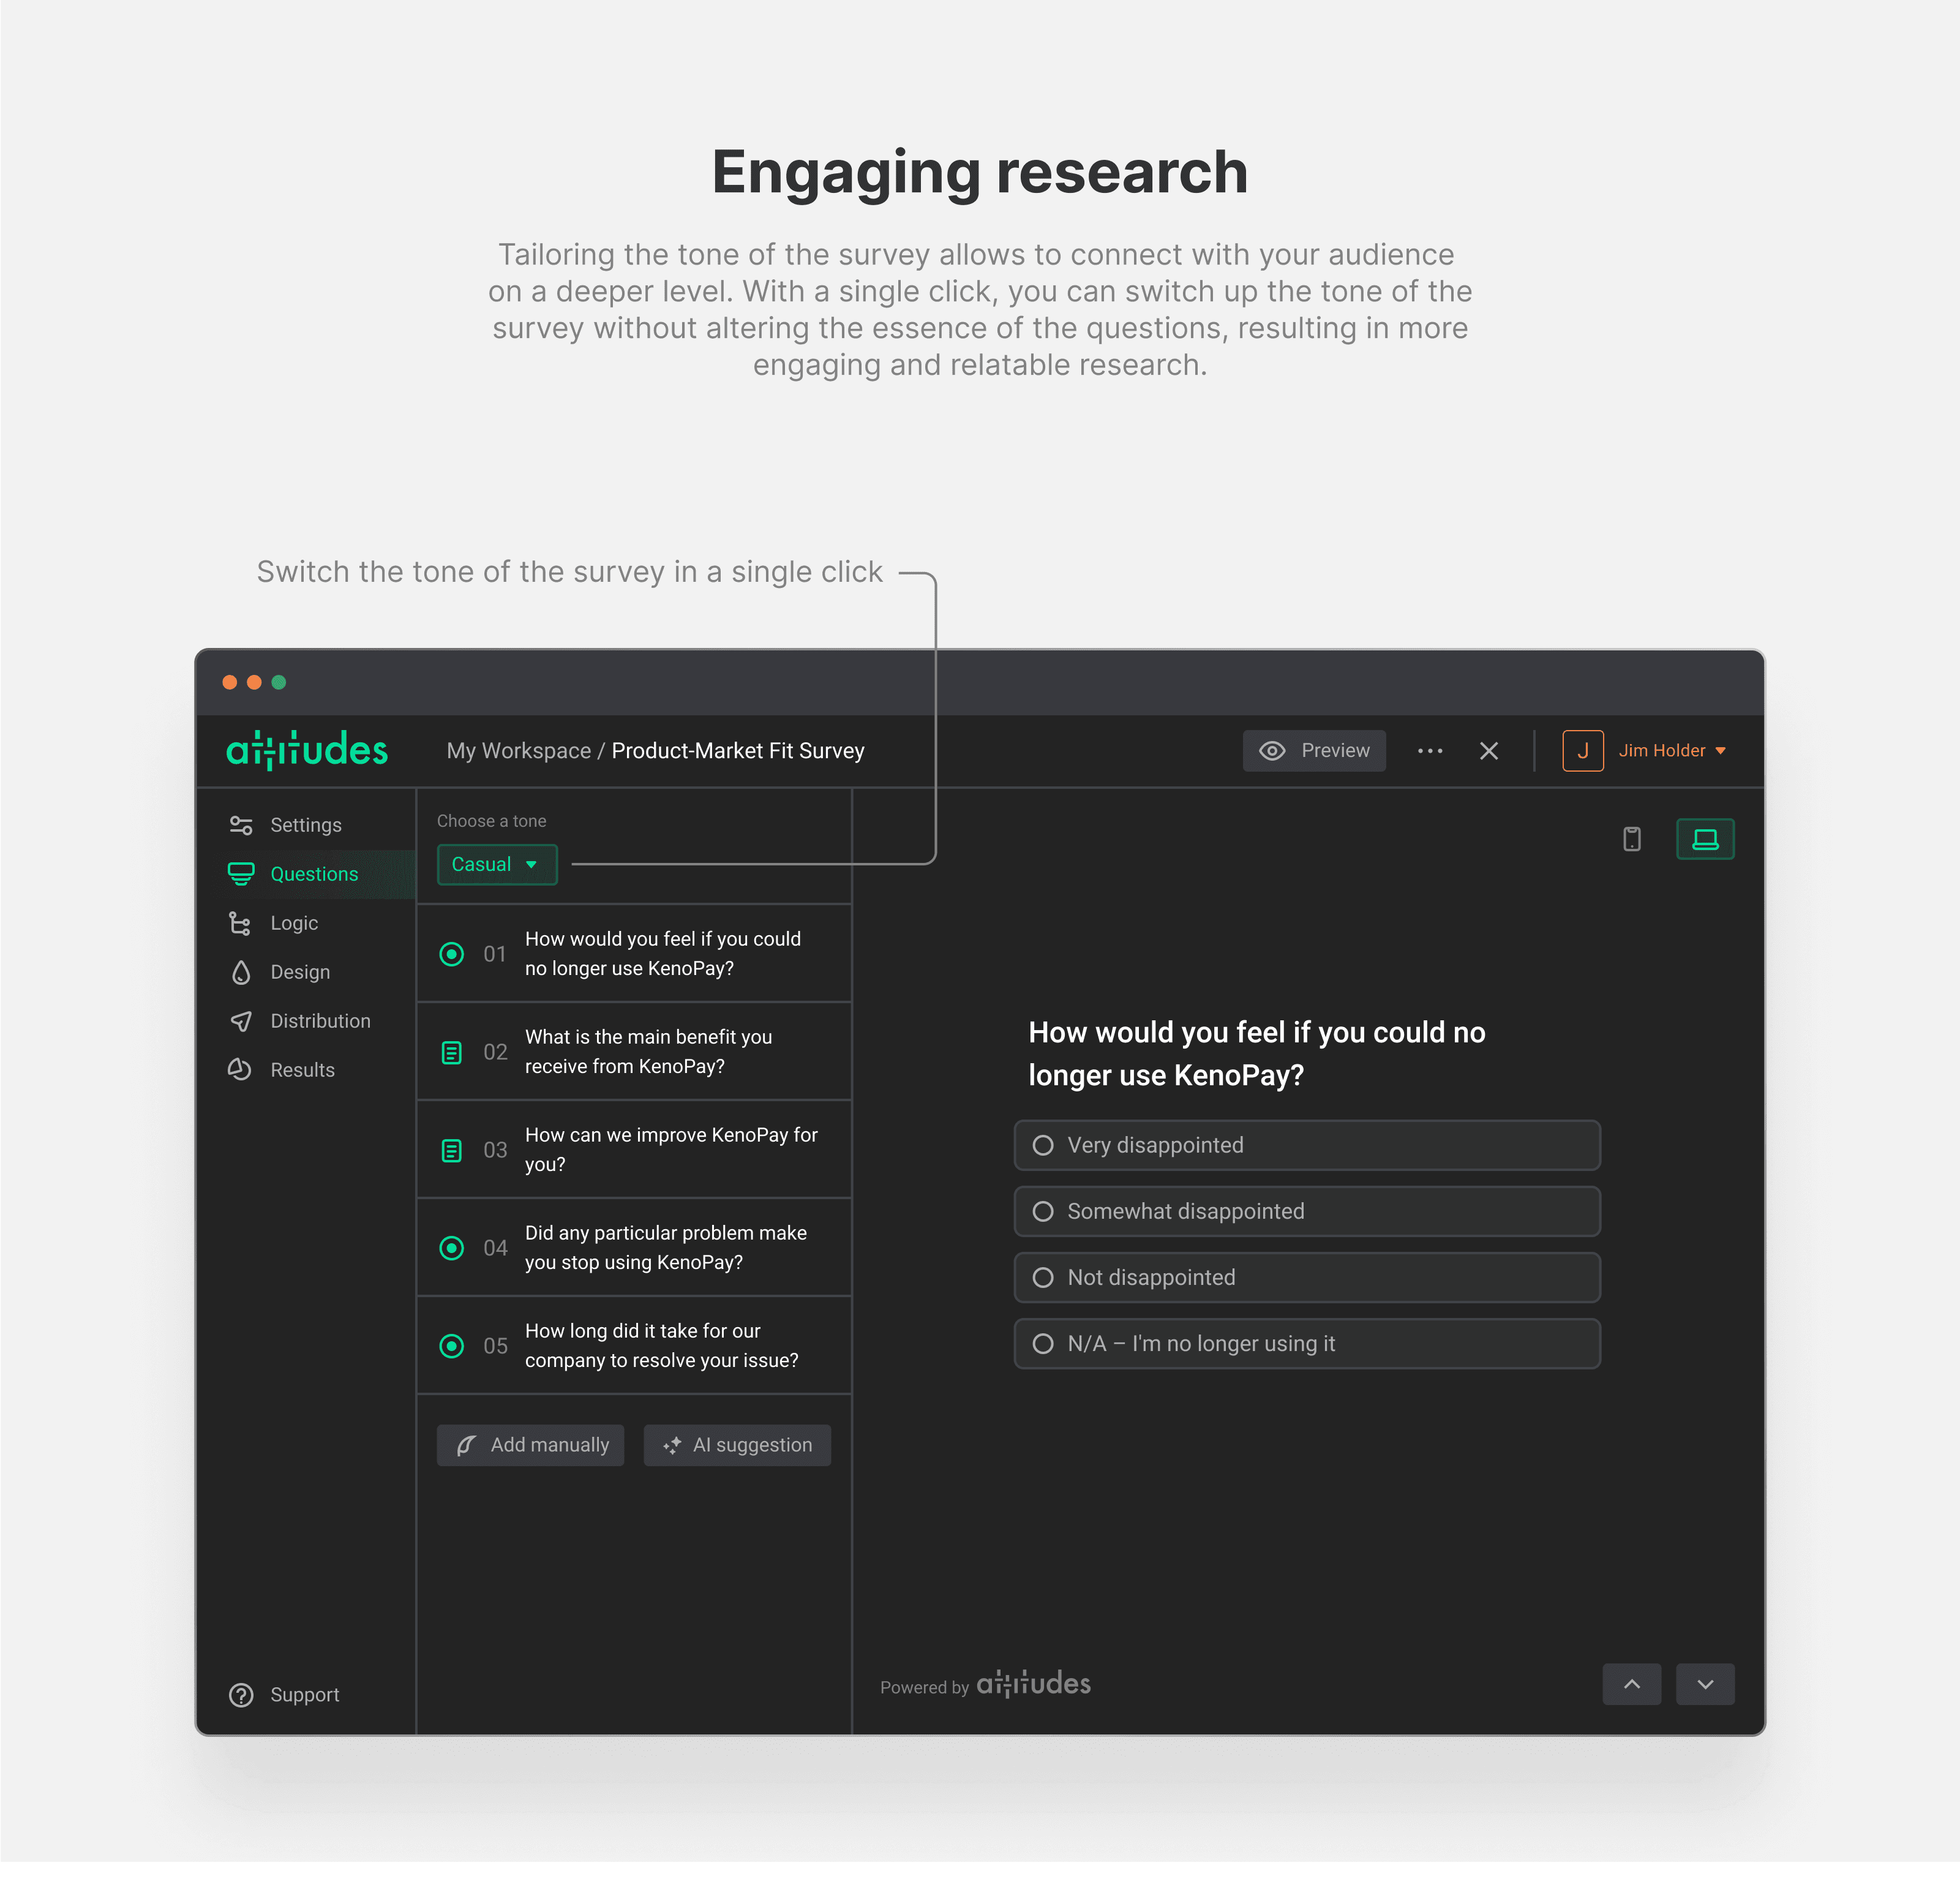
Survey tone selection. The ability to switch the tone of a survey with a single click without altering the essence of the questions, so that your message resonates with the audience on a deeper level.
Automated survey design. Identification and and applying key brand colors and typography based on uploaded brand logos, links to website, and marketing materials.
Get responses
Multiple media formats. Responding to consumers' preferences by accepting and automatically interpreting audio and video responses for open-ended questions, making it easier for Gen Z consumers to give answers in a way they prefer.
Analyze results
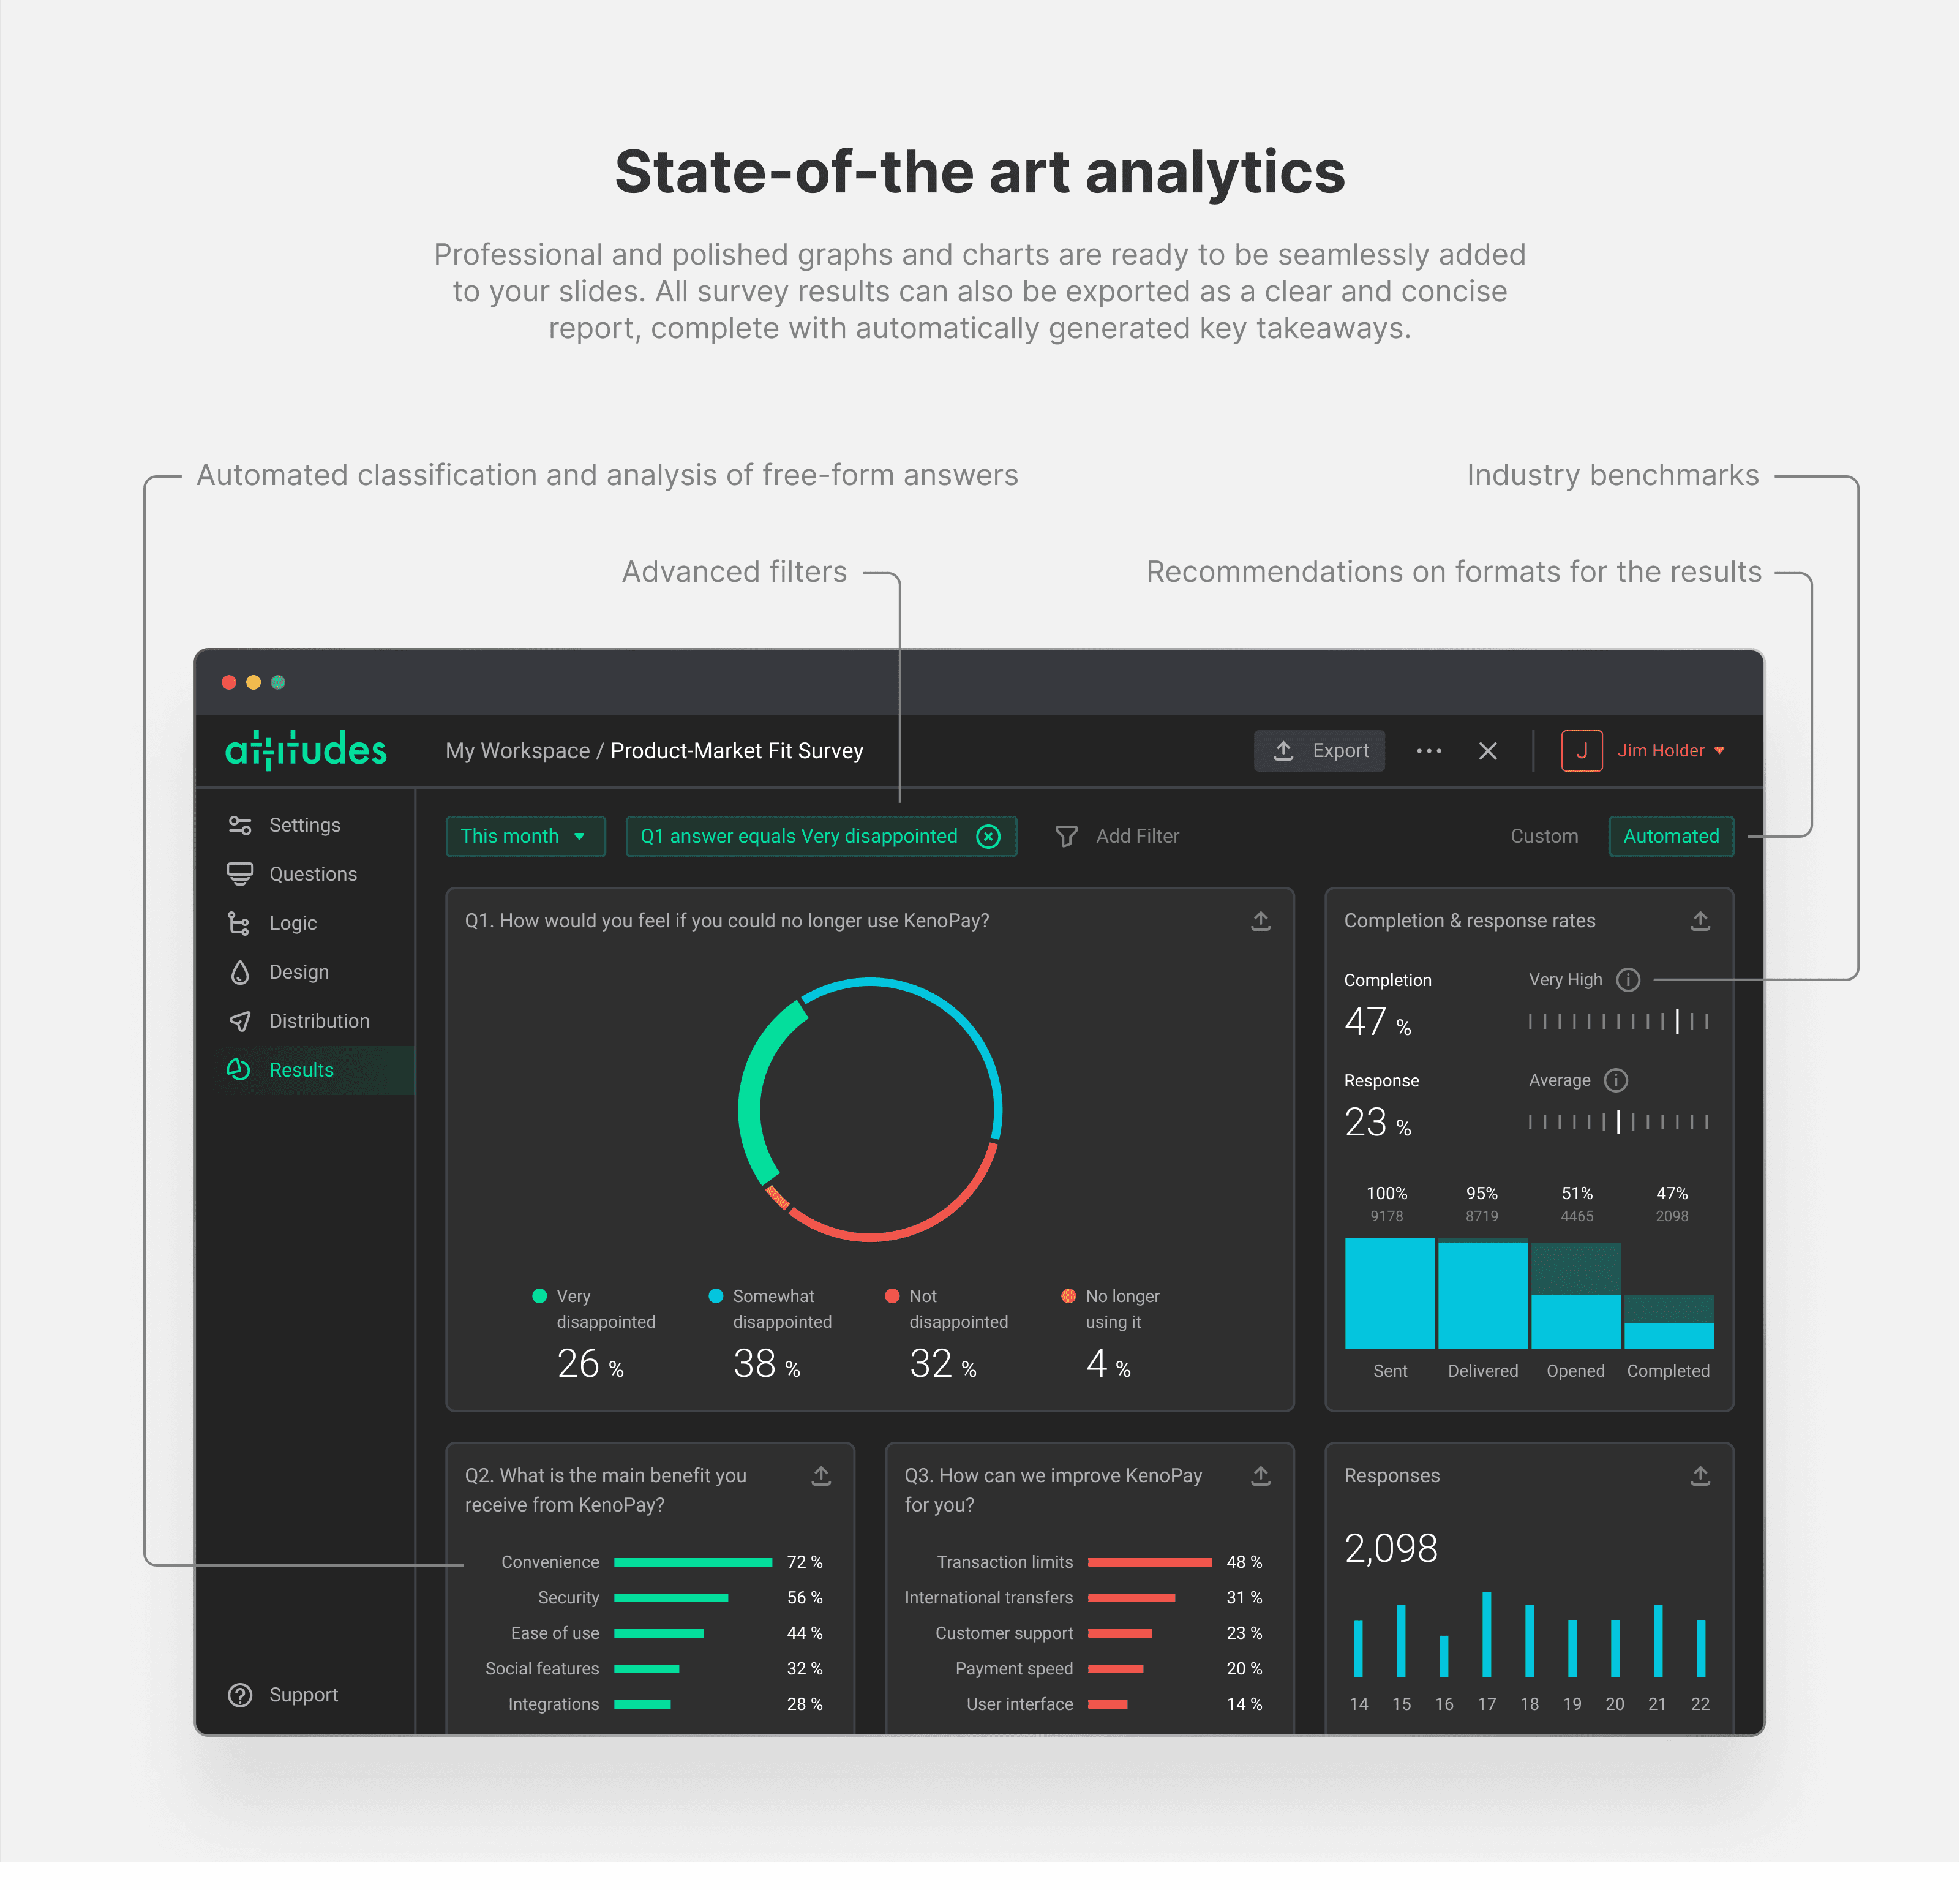
AI-assisted analysis. Detecting the types of questions and answer choices, and suggesting the most appropriate format for the results to reveal insights. Automatically generated conclusions and key takeaways for multiple-choice questions.
Polished graphs and charts. Professional graphs and charts that are easily exported and are ready to be seamlessly added to slides for presentations and discussions with the team and management.
After gathering all the insights, I've created a detailed platform concept, brainstormed potential key features, developed initial prototypes, and designed user interfaces. I've divided features by the stages in the survey creation process.
Create survey
Suggested questions and formats. AI-enabled suggestions based on most popular tasks, position of the person creating the survey, industry, survey type and topic. Ensuring questions are clear and unbiased. Suggestions of question type (multiple-choice, free-form, etc.) based on questions asked.
Automated survey logic. Using artificial intelligence to add branching logic for skipping questions, creation of follow-up questions, and "fillers"/"connectors" between questions to acknowledge previous answers of respondents.
Survey tone selection. The ability to switch the tone of a survey with a single click without altering the essence of the questions, so that your message resonates with the audience on a deeper level.
Automated survey design. Identification and and applying key brand colors and typography based on uploaded brand logos, links to website, and marketing materials.
Get responses
Multiple media formats. Responding to consumers' preferences by accepting and automatically interpreting audio and video responses for open-ended questions, making it easier for Gen Z consumers to give answers in a way they prefer.
Analyze results
AI-assisted analysis. Detecting the types of questions and answer choices, and suggesting the most appropriate format for the results to reveal insights. Automatically generated conclusions and key takeaways for multiple-choice questions.
Polished graphs and charts. Professional graphs and charts that are easily exported and are ready to be seamlessly added to slides for presentations and discussions with the team and management.